
Regional differences in the vascular response to CO2 among cerebral, ocular, and mesenteric vessels
- DOI
- 10.1016/j.artres.2015.08.001How to use a DOI?
- Keywords
- Cerebral circulation; Ocular circulation; CO2 reactivity; Endothelial function
- Abstract
Background: It is well-known that cerebral and ocular vessels are highly sensitive to changes in the partial pressure of CO2 (PETCO2). However, it is unclear whether there are regional differences in the magnitude of the vascular response to CO2 (CO2 reactivity) in various vessels of a single individual, and whether there is a relationship in the CO2 reactivity of specific vessels between different individuals.
Methods: We compared the CO2 reactivity of the superior mesenteric artery (SMA), middle cerebral artery (MCA), retinal artery (RA), and retinal and choroidal vessels (RCV) during a 3-min inhalation of CO2-rich air (5%) in 70 subjects.
Results: The blood flow velocities in the MCA, RA, and RCV significantly increased by 21 ± 2% (mean ± SE), 9 ± 1%, and 7 ± 2%, respectively (P < 0.05) during hypercapnia, whereas that in the SMA did not change significantly (−17 ± 11%). The CO2 reactivity–the relative change in blood flow to a given change in PETCO2–was significantly greater in the MCA (2.2 ± 0.2%/mmHg) than in the RA and RCV (0.9 ± 0.1%/mmHg and 0.8 ± 0.2%/mmHg, respectively). There was a weak correlation in the CO2 reactivity only between RA and RCV (r = 0.43, P < 0.05).
Conclusion: These findings indicate that the CO2 reactivity can vary even in cerebral and ocular vessels, although the correlation is weak.
- Copyright
- © 2015 Association for Research into Arterial Structure and Physiology. Published by Elsevier B.V. All rights reserved.
- Open Access
- This is an open access article distributed under the CC BY-NC license.
Introduction
Cerebral and ocular vessels have similar physiological and anatomical characteristics, and they are both highly sensitive to changes in the partial pressure of arterial CO2 (PaCO2).1–7 An elevation of PaCO2 (hypercapnia) induces vasodilatation in these vessels, while a reduction of PaCO2 (hypocapnia) induces vasoconstriction.8,9 The cerebral and ocular circulations involve neighboring vessels that branch off from the internal carotid artery, and both are innervated by the superior cervical sympathetic nerve.10
The magnitude of the vascular response to CO2, which is called CO2 reactivity, differs between cerebral and ocular vessels. The change induced by an increase in PaCO2 has been reported to be greater in the cerebral artery than in the ocular artery.6 However, it is still unclear whether there is a relationship between the CO2 reactivity of cerebral and ocular arteries; in other words, whether or not individuals with a CO2 reactivity that is greater in cerebral vessels also exhibit a greater reactivity in ocular vessels.
The vascular responses to changes in CO2 in vessels other than cerebral and ocular vessels, such as vessels supplying the digestive organs and kidneys, are unclear. It is important to understand the responses of these vessels, since the vessels in digestive organs, which account for 25% of the resting cardiac output,11 play an important role in blood pressure regulation.12 Vessels are characterized by various properties, such as the vascular diameter, the types of constituent cells, and the downstream organs. Variations in these properties make it highly likely that the vascular response to the same stimulus exhibits regional differences.
Hypercapnia is likely to induce vasoconstriction in vessels in digestive organs against the decrease in blood pressure associated with cerebral vasodilatation and sympathetic activation induced by the elevation of PaCO2,13 and most vessels are themselves sensitive to CO2. The response to hypercapnia in vessels in digestive organs can therefore differ from those of cerebral and ocular vessels. However, few studies have compared the vascular responses to hypercapnia in various vessels simultaneously.7,14
Endothelial dysfunction of nontargeted and/or unobserved vessels can be missed at a medical checkup unless researchers and/or medical staff understand about regional differences in the vascular response and the magnitude of variations in endothelial function among vessels throughout the body. Besides regional differences in vascular responses, there appear to be regional differences in endothelial function and in the progression of endothelial dysfunction. Standardized assessments of endothelial function, including flow-mediated dilatation (FMD) and the intima-media thickness (IMT), use the vascular response to physiological stimuli or morphological properties in targeted vessels. Kimoto et al. found regional differences in induced increases in arterial stiffness.15 In addition, we can interpret the absence of a relationship between a decrease in FMD in the brachial artery and a decrease in the CO2 reactivity of the cerebral artery16 as evidence for the presence of endothelial responses with different magnitudes in an individual. Thus, for the early detection of endothelial dysfunction, it is important to examine regional differences in vascular response and the magnitude of the vascular response to the same stimulus.
The objective of this study was to test the following two hypotheses: (1) there are regional differences in the vascular response to CO2 in various vessels of a single individual, and (2) there is a correlation in the CO2 reactivity of specific vessels between different individuals. To achieve this objective, we observed the responses of blood flow velocities in the superior mesenteric artery (SMA), middle cerebral artery (MCA), retinal artery (RA), and retinal and choroidal vessels (RCV) during hypercapnia.
Methods
Subjects
Seventy healthy males with the following characteristics participated in this study: age, 22 ± 2 years (mean ± SD); height, 173.5 ± 5.8 cm; and body mass, 64.5 ± 8.8 kg. All of the subjects were free of any known autonomic dysfunction and cardiovascular and ocular diseases, and were not taking any medications. This study was approved by the ethics committees of the Institution of Health Science, Kyushu University and the Tokyo Institute of Technology, Japan. All of the protocols used conformed with the standards set by the Declaration of Helsinki. Each subject received verbal and written explanations of the objectives, measurement techniques, and risks and benefits associated with the study and then provided written informed consent. Subjects were requested to abstain from caffeinated beverages and strenuous exercise for 6 h, and from eating for at least 2 h prior to the measuring trial.
Experimental protocol
After setting up the instrumentation and a 2-min baseline period in a seated position, each subject inhaled CO2-rich air (5%) for 3 min to increase the end-tidal partial pressure of CO2 (PETCO2).
We could not simultaneously measure the blood flow velocities in the targeted vessels due to methodological limitations. Forty subjects repeated the above trial twice. In one trial, the blood flow velocities in the MCA and SMA were measured simultaneously. In the other trial, the blood flow velocities in ocular vessels were measured. These two trials were performed in a randomized order. In another 30 subjects we measured the blood flow velocities in the MCA and ocular vessels simultaneously, but not in the SMA. All trials for each subject were conducted within 1 h and with a washout period of longer than 15-min.
Measurements
The beat-by-beat arterial pressure was continuously monitored with an automatic sphygmomanometer whose probe was attached to the right middle finger (Finometer, Finapres Medical Systems, Amsterdam, Netherlands), and it was transformed into the mean arterial pressure (MAP). The electrocardiogram was monitored with a bioelectrical amplifier (MEG2100, Nihon-Kohden, Tokyo, Japan).
The ocular blood flow velocity was measured using laser-speckle flowgraphy (LSFG, SoftCare, Fukuoka, Japan). The blood flow velocity in the MCA was measured using transcranial Doppler ultrasonography (WAKI, Atys Medical, Lyon, France). The blood flow velocity in the SMA was measured using simultaneous pulsed and echo Doppler ultrasound flowmetry (LOGIQ3, GE Medical Systems, CT, USA). These measurements were performed three times during the last 1 min of the baseline period and when breathing CO2-rich air.
During all of the protocols and trials, the subjects breathed through a mouthpiece with putting a nose clip in place. This mouthpiece was connected to a hot-wire flowmeter and a gas analyzer (RM-300 and MG-300, Minato Medical Science, Fukuoka, Japan) for measuring the tidal volume and PETCO2. The flowmeter was calibrated using a 2-L syringe. Small samples of respired gas (150 ml/min) were taken from the mouthpiece and analyzed for O2 and CO2. The gas analyzer was calibrated with fresh air and precision gas. As described below, subjects held their breath three times during the last 1-min stage of each trial.
RA and RCV measurements
Laser-speckle images of the ophthalmic circulation were obtained using LSFG, which is a noninvasive technique that can be used to measure two-dimensional relative blood flow velocities in the microcirculation based on laser speckle.17 Laser speckle is an interference phenomenon associated with coherent light sources such as lasers, whereby illumination of a tissue with laser radiation induces a speckle pattern whose structure changes rapidly according to the velocity of the targeted object (the blood flow velocity in the present study).18,19 The irradiation emitted from a laser diode (wavelength of 830 nm) was transmitted to part of the intraocular tissue. The observation field was 750 × 360 pixels, which corresponded to an ocular area of 3 × 5 mm2. The real-time blood flow map was produced from the measured mean blur rate (recorded 30 frames/s), which is a quantitative index of the relative blood flow velocity.
Two-dimensional perfusion maps were determined from the quantified data of the blood flow velocity obtained using the software supplied with the LSFG device (SoftCare). This software identifies the bifurcation of arterioles and makes automatic adjustments to ensure that the targeted area is the same on every captured frame.
Subjects were asked to open their right eye for 6 s during the image recording. Ocular perfusion data were obtained from the RA and retinal and RCV. The RCV covered a field of observation between the optic nerve head and the macula. The blood flow velocity in the RA was calculated from the integral of the cross-sectional map of blood velocity within the selected arteriole. This meant that the blood flow velocity in the RA reflected the blood flow volume. The RCV data reflect both the choroidal and retinal circulations, since the LSFG apparatus cannot separate these two signals. The measured blood flow velocity measured in the RCV in the present study would have been mainly from the choroidal circulation, since choroidal vessels supply 85% of the total ocular blood flow to the retina.20
SMA measurements
Simultaneous pulse and echo Doppler ultrasound flowmetry was used to measure the blood flow velocity in the SMA. A curved-array Doppler-scan probe with a 3.3-MHz pulsed Doppler frequency was used. This device allows a real-time cross-sectional image (i.e., of the B-mode echoes) to be displayed simultaneously with the real-time Doppler spectral display and sound, enabling the experimenter at all times to visually realign the ultrasound beam with the artery so as to avoid a failure of Doppler insolation due to blood vessel movement during each measuring trial. The focal zone was at the depth of the SMA, and at the proximal segment of this artery. The Doppler beam insolation angle was maintained at 60° or less relative to the blood vessel. Following a previously described technique,21,22 the quality of the Doppler tracing was maximized by determining the optimal positions of the Doppler probe for each subject (via an anterior abdominal approach) before recording data in the trials. After adjusting the sample volume width to cover the targeted artery, subjects were asked to hold their breath for 6 s. Then the Doppler transducer was maintained at a constant position on the subject’s anterior abdominal wall for the entire measuring trial. When the experimenter detected that the probe angle or position had changed, he or she simply readjusted the probe. No sudden changes in blood velocity were observed during these readjustments.
The signals for the antegrade and retrograde blood cell velocities, as well as the ECG signal, were digitally sampled at 20 kHz using an A/D converter (PowerLab 8s/30, ADInstruments, CO, USA). The spectra of the signals were manipulated offline by own Doppler signal-processing software–using a fast Fourier transform with a 256-point Hamming window (i.e., every 12.8 ms) –and instantaneous mean blood velocity data were calculated.
Breathing control
Subjects controlled their breathing so that the blood flow velocity in the SMA could be determined accurately. Breathing induces movements in the abdomen and changes the distance from the surface of the abdomen to the SMA, affecting measurement of the flow velocity therein. Subjects held their breath for 6 s immediately after naturally breathing out under command from a cue word spoken by the experimenter. In order to exclude the effect of breathing control, 40 subjects who repeated the trial twice controlled their breathing during the RA and RCV measuring trial, as well as the SMA measuring trial. In the RA and RCV measuring trial, subjects held their breath while keeping their eyes open for 6 s.
Data analysis
The data are expressed as mean and SE values. The cutoff for statistical significance was set at P < 0.05. All statistical analyses were performed with the Statistical Package for the Social Sciences (IBM SPSS Statistics 21.0 for Windows, IBM, Tokyo, Japan).
Subjects who exhibited a change in PETCO2 of less than 5% relative to the resting control were excluded from the data analysis. The vascular responses to hypercapnia were assessed by the change in the blood flow velocity relative to the resting control. Ocular blood flow data were used in the analysis only when clear laser-speckle imaging data were obtained over at least two consecutive heart beats. The CO2 reactivity (in %/mmHg) was calculated by dividing each relative change in the blood flow velocity (in %) by the change in PETCO2 (in mmHg). The conductance index (CI) of each vessel was calculated by dividing the instantaneous value of the blood flow velocity by the MAP at the corresponding time. Pearson correlation analysis was used to evaluate the CO2 reactivity relationships among various vessels.
Results
We obtained 49, 45, and 47data values from the MCA, RA, and RCV, respectively. In contrast, only 22 data values were obtained from the SMA due to thick abdominal fat or muscle, or poor control of breathing.
The CO2 reactivity of each vessel did not differ significantly between the two sets of measurements (the RA and RCV measuring trial, and the SMA measuring trial) or between the two groups (separately or simultaneously measuring the MCA and ocular vessels). We therefore analyzed all of the data together.
The inhalation of CO2-rich air induced significant increase in the MAP and PETCO2 from baseline values by 5 ± 1% and 25 ± 1%, respectively (both P < 0.05) (Table 1). The blood flow velocities in MCA, RA, and RCV significantly increased by 21 ± 2%, 9 ± 1%, and 7 ± 2%, respectively (all P < 0.05), whereas that in the SMA did not change. The change in the blood flow velocity in the MCA was correlated with the change in PETCO2 (r = 0.57, P < 0.05). The CIs in the MCA and RA significantly increased by 14 ± 2% and 4 ± 2%, respectively (both P < 0.05). The CI in the SMA significantly decreased by 21 ± 5% (P < 0.05) during hypercapnia, while the blood flow velocity in the SMA did not change significantly. The CO2 reactivity of the MCA was 2.2 ± 0.2%/mmHg, and this was significantly greater than the reactivity in the RA and RCV (0.9 ± 0.1%/mmHg and 0.8 ± 0.2%/mmHg respectively) (both P < 0.05) (Fig. 1). There was an interindividual correlation in the CO2 reactivity only between the RA and RCV (r = 0.43, P < 0.05) (Table 2).
| Relative change (%) | ||
|---|---|---|
| MAP | 5 ± 1 * | |
| PETCO2 | 25 ± 1 * | |
| Blood flow velocity | SMA | −17 ± 11 |
| MCA | 21 ± 2 *, † | |
| RA | 9 ± 1 * | |
| RCV | 7 ± 2 * | |
| Conductance index | SMA | −21 ± 5 * |
| MCA | 14 ± 2 * | |
| RA | 4 ± 2 * | |
| RCV | 2 ± 2 |
Data are mean and SE values, Data are mean and SE values. All variables during the treatment changed significantly from the resting baseline values, except for the blood flow velocity in the superior mesenteric artery (SMA) and the conductance index in the retinal and choroidal vessels (RCV).
P < 0.05 vs. baseline.
P < 0.05 interindividual correlation with the end-tidal partial pressure of CO2 (PETCO2). MAP, mean arterial pressure; MCA, middle cerebral artery; RA, retinal artery.
Cardiorespiratory and vascular changes from baseline to hypercapnia.
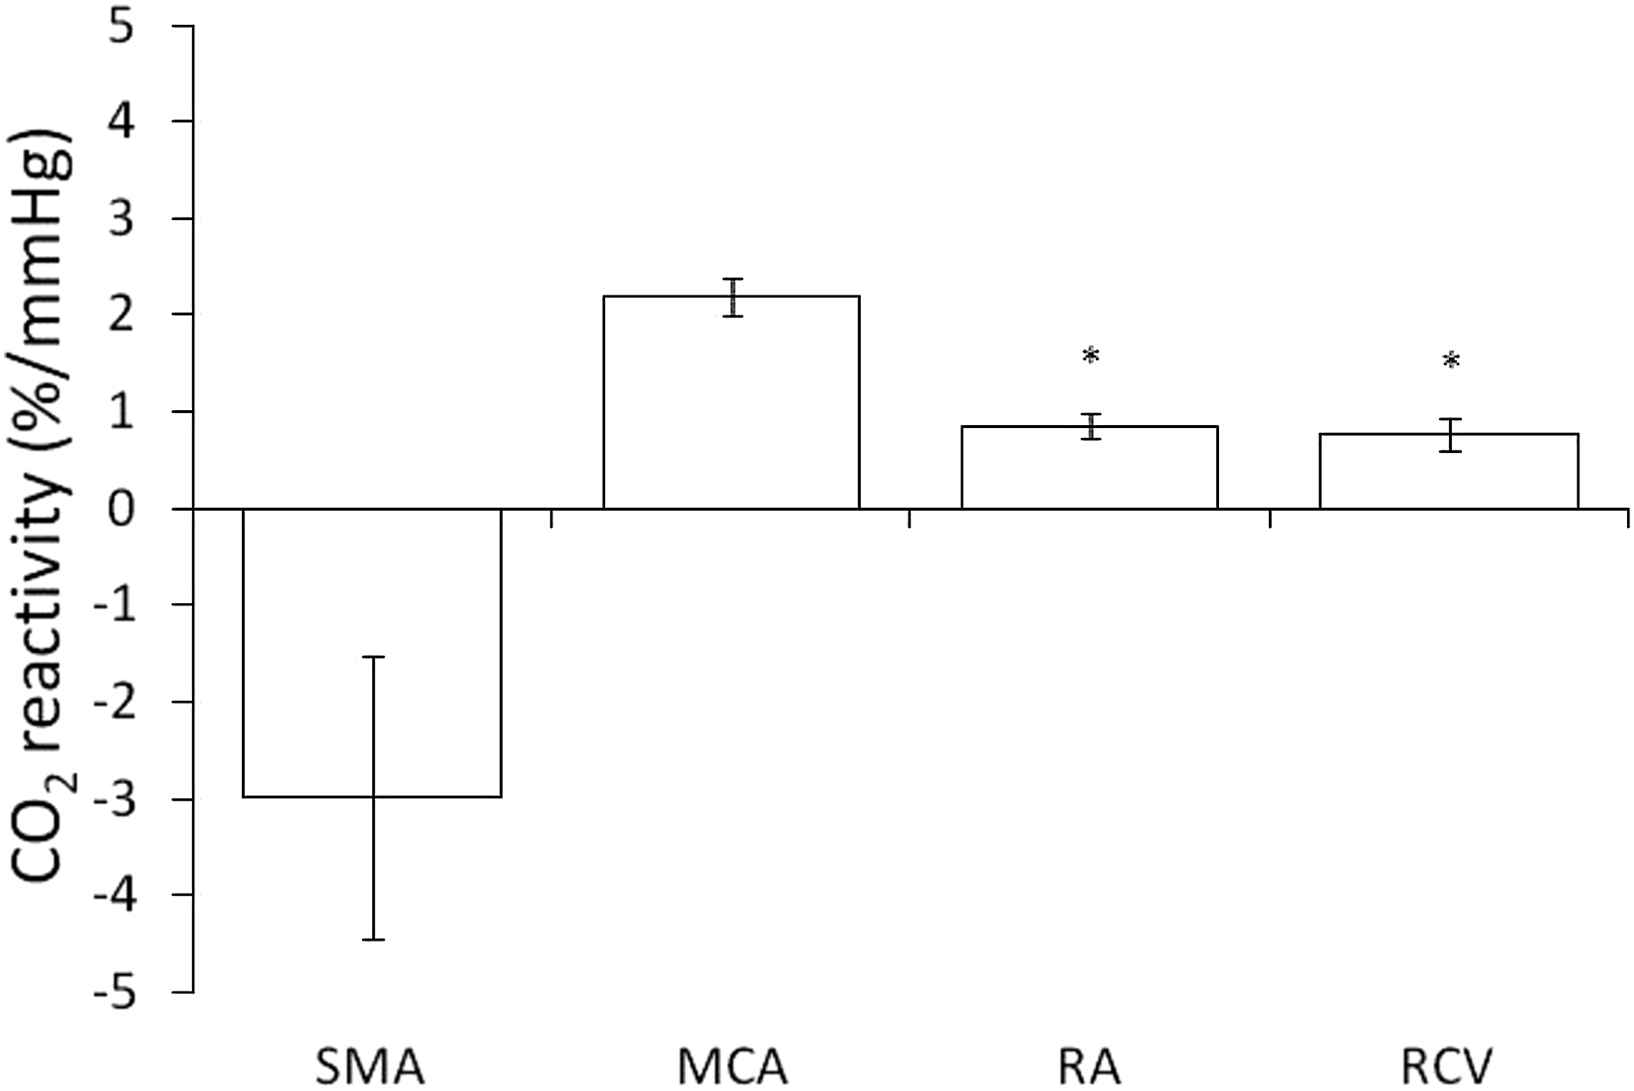
The CO2 reactivity was significantly greater in the middle cerebral artery (MCA) than in the retinal artery (RA) and the retinal and choroidal vessels (RCV). Data are mean and SE values. *P < 0.05 vs. MCA. SMA, superior mesenteric artery.
| MCA | RA | RCV | |
|---|---|---|---|
| SMA | r = 0.32 P = 0.19 |
r = 0.07 P = 0.80 |
r = −0.01 P = 0.96 |
| MCA | r = 0.13 P = 0.45 |
r = 0.02 P = 0.93 |
|
| RA | r = 0.43 P < 0.05 |
The only significant interindividual correlation in the CO2 reactivity was between the retinal artery (RA) and retinal and choroidal vessels (RCV), and this correlation was weak.
Interindividual correlations in the CO2 reactivity among targeted vessels.
Discussion
This study investigated whether there are regional differences in the vascular response to CO2 in various vessels in a single individual, and whether there is a correlation in the CO2 reactivity of specific vessels between different individuals, by assessing responses of the blood flow velocities in the SMA, MCA, RA, and RCV to a given change in PETCO2. The main findings of the present study are the presence of regional differences in the vascular response, and a weak (or no) interindividual correlation in the CO2 reactivity among all targeted vessels. The results therefore did not support the hypothesis that the CO2 reactivity of neighboring vessels are related, although an increased response itself to an increase in CO2 was common in cerebral and ocular vessels. The interindividual correlation between the RA and RCV was also very weak. These vessels are close to the retina, and both are sensitive to CO2. Nevertheless, individuals who exhibited a greater response of the RA did not always show a greater response of the RCV.
The blood flow velocities in the cerebral and ocular vessels increased with PETCO2, as reported previously, whilst the CI in the SMA significantly decreased during hypercapnia. The mechanism underlying the response of a vessel to a change in CO2 is not fully understood, but it is well known that cerebral and ocular vessels dilate during hypercapnia.1–7 The present study assessed the vascular response of vessels in digestive organs, rather than only in brain and ocular vessels. This showed that cerebral vessels, ocular vessels and the SMA showed different responses to a given change in PETCO2.
These different responses might be affected by various properties of the vessels. The CO2 reactivity was significantly greater in the cerebral circulation than in the ocular circulation, as our group has reported previously.6 These results together suggest that the magnitude of the vascular response differs between various vessels, even though those vessels show similar responses to a given stimuli and are in close proximity. It was also reported previously that there are no significant changes in the femoral artery during hypercapnia.14 It has long been appreciated that these differences are likely to be influenced by anatomical and functional differences in these associated vascular beds, such as in the nerve innervation, distribution of α-adrenoreceptors, and rate of O2 metabolism.7,14,23,24
The vasoconstriction in the SMA during hypercapnia could be explained by the baroreflex. An increase in CO2 induced vasodilatation in cerebral and ocular vessels. This response represents an attempt to decrease blood pressure, and this is followed by the baroreflex inducing vasoconstriction in other vessels aimed at maintaining the blood pressure.11 Vasoconstriction in the SMA may play a role in maintaining the blood pressure against vasodilatation in the cerebral and ocular vessels during hypercapnia.
Only one significant correlation was observed in the CO2 reactivity among targeted vessels. Whether the CO2 reactivity of various vessels are correlated has not been examined, while many previous studies have compared the CO2 reactivity between cerebral and ocular vessels.1–7 We hypothesized that there is a correlation in the CO2 reactivity among various vessels. However, we found only a weak correlation in the CO2 reactivity only between the RA and RCV. These results indicate that individuals exhibiting a CO2 reactivity that is greater in a certain vessel do not always show a greater reactivity in other vessels, even though those vessels have anatomically and functionally similar properties, such as in the cerebral and ocular circulations.
The finding of non-uniform CO2 reactivity in the present study suggests that any assessments of the function of particular vessels must involve only those vessels in the targeted anatomical region. The gold-standard assessments of endothelial function (e.g., FMD and the IMT) are based on the vascular response to physiological stimuli and the thickness of the vascular wall. Those assessments represent useful and reproducible methods, and their results are correlated with cardiovascular disease to some extent.25–29 In turn, methodologies such as FMD and the IMT may not predict the function of a particular vessel throughout the body, when we attribute the CO2 reactivity to endothelial function, since the present results suggest the presence of regional differences in the vascular responses to physiological stimuli and that there is no relationship in the vascular response to stimuli among different vessels. This means that a diagnosis based on measurements in a single vessel can only provide information on that vessel in a specific area. Kimoto et al. reported that the progression of endothelial dysfunction is also likely to differ regionally,15 and not only in terms of the vascular response. These possibilities need to be considered when assessments of endothelial function are based on a single vessel.
This study was subject to several limitations. Only a small number of blood flow velocity values were obtained in the SMA due to interference from thick abdominal fat or muscle, or poor control of breathing during data acquisition, and so we could not draw conclusions about the vascular response of the SMA. To compare CO2 reactivity among various vessels, we assessed the relative change in the blood flow velocity relative to a 1-mmHg change in PETCO2, as used in previous studies involving the cerebral arteries.7 It is unclear whether this assessment is reasonable for vessels other than those in the brain. The present study had a cross-sectional design, and so longitudinal changes in the targeted vessels were not conclusive. Future studies need to investigate regional differences in longitudinal changes in various vessels.
Conclusion
We compared the CO2 reactivity in the SMA, MCA, RA, and RCV during hypercapnia. The blood flow velocities in the MCA, RA, and RCV increased significantly with the inhalation of CO2-rich air for 3 min, whereas that in the SMA did not change. The CO2 reactivity was significantly greater in the MCA than in RA and RCV. No correlation was found in the CO2 reactivity either among subjects or among targeted vessels, except for a weak correlation between the RA and RCV. These findings indicate the presence of regional differences in the CO2 reactivity of various vessels.
Conflict of interest
The authors have no financial conflict of interest.
Acknowledgment
This work was supported by
References
Cite this article
TY  - JOUR
AU  - A. Miyaji
AU  - T. Ikemura
AU  - Y. Hamada
AU  - N. Hayashi
PY  - 2015
DA  - 2015/09/06
TI  - Regional differences in the vascular response to CO2 among cerebral, ocular, and mesenteric vessels
JO  - Artery Research
SP  - 54
EP  - 59
VL  - 12
IS  - C
SN  - 1876-4401
UR  - https://doi.org/10.1016/j.artres.2015.08.001
DO  - 10.1016/j.artres.2015.08.001
ID  - Miyaji2015
ER  -