P9.01 DETERMINANTS OF ARTERIAL STIFFNESS: A 16-YEAR FOLLOW-UP FROM THE WHITEHALL II STUDY
- DOI
- 10.1016/j.artres.2010.10.093How to use a DOI?
- Open Access
- This is an open access article distributed under the CC BY-NC license.
Background: Although several risk factors for cardiovascular disease (CVD) have been shown to be associated with arterial stiffness, the relative importance of these determinants is largely unknown. The aim of this study is to compare the relation between a wide range of baseline CVD risk factors and arterial stiffness 16 years later in a middle-aged population of civil servants.
Methods: We studied 3591 participants of the Whitehall II cohort. At baseline (1991–1993) blood pressure, BMI, waist and hip circumference, a lipid profile, fasting and 2-hour glucose were measured, and information on physical activity, alcohol intake, smoking habits, and employment grade was collected. At follow-up (2007–2009) arterial stiffness was assessed by carotid-femoral pulse wave velocity (PWV). Medication use, incident diabetes and coronary heart disease (CHD) events were assessed throughout the follow-up period. The association between baseline determinants and PWV was assessed through linear regression analysis stratified by sex and adjusted for baseline age, BMI, employment grade, and mean blood pressure at time of PWV measurement. When relevant, analyses were further adjusted for incident diabetes, CHD events, antihypertensive medication, and lipid-lowering medication. The standardised regression coefficients were compared.
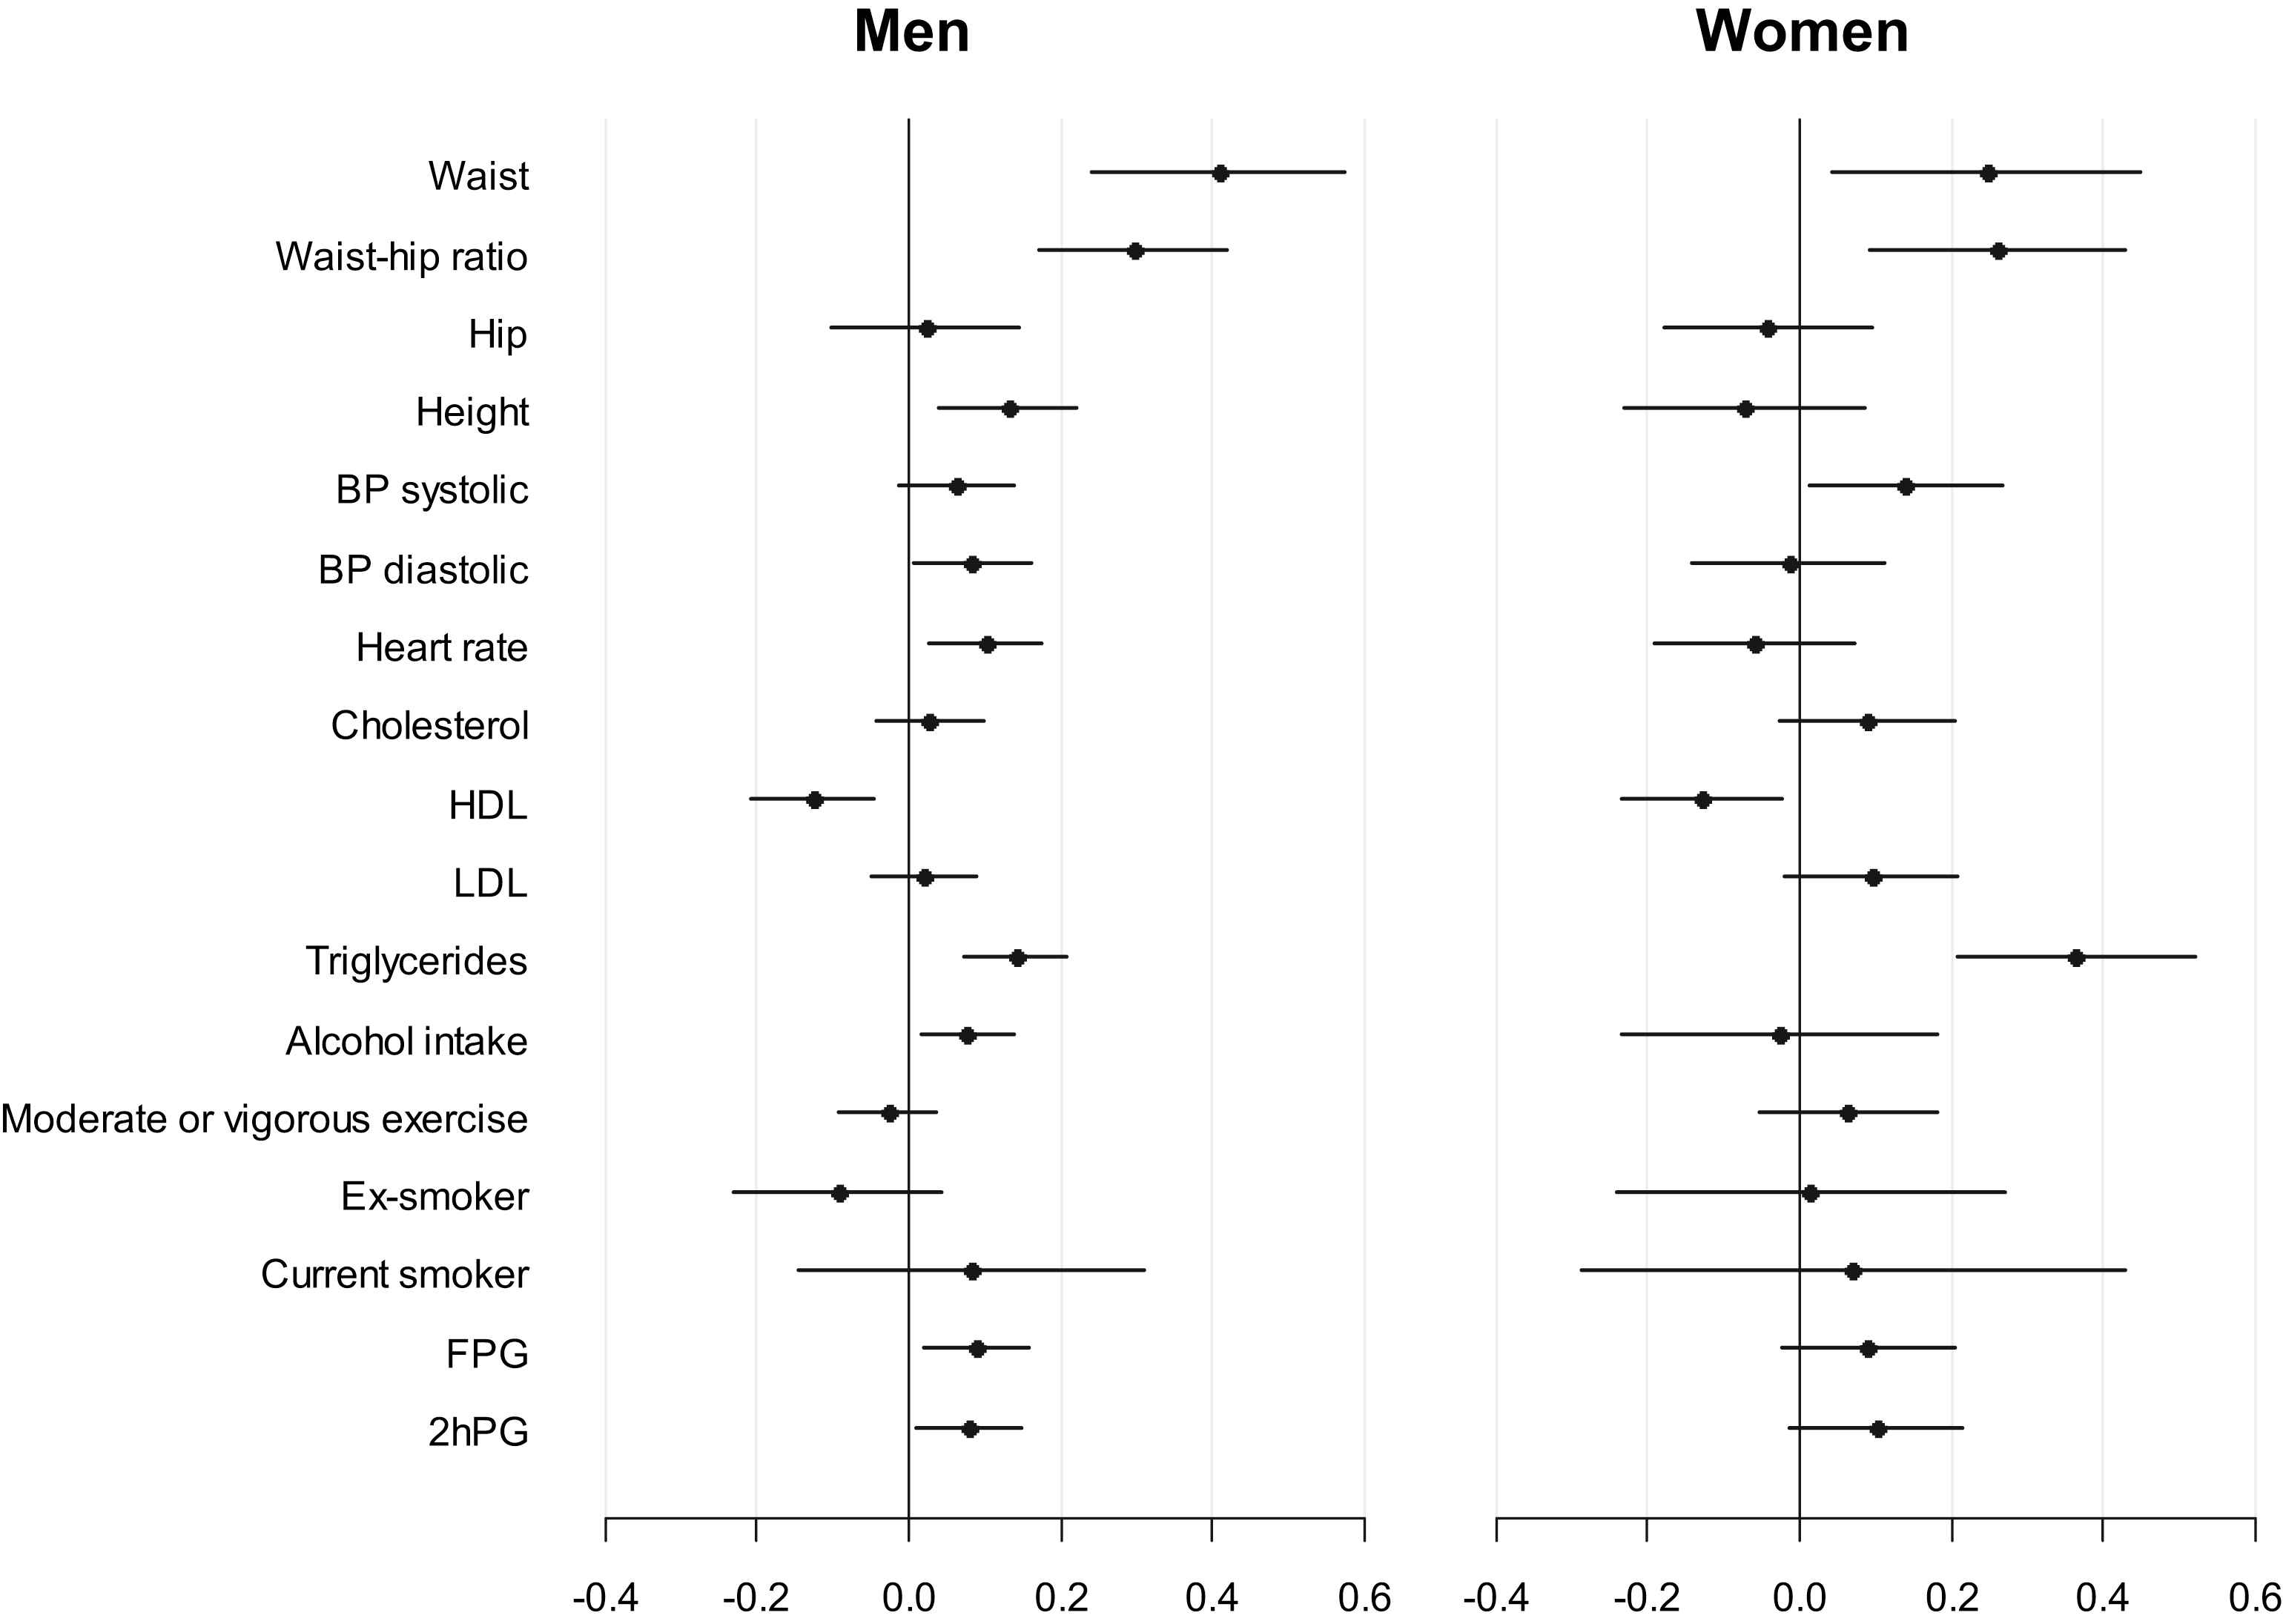
Results: Table 1 shows the characteristics of the study population. Figure 1 shows the standardised regression coefficients. For men, waist/hip ratio was the strongest determinant of PWV, whereas for women it was triglycerides.

Standardised regression coefficients for predicting PWV. Coefficients are adjusted for baseline age, BMI, employment grade, and mean blood pressure at time of PWV measurement. When relevant, coefficients are further adjusted for incident diabetes, CHD events and medication.
FPG: fasting plasma glucose, 2hPG: 2-hour plasma glucose.
| Men | Women | |
|---|---|---|
| N | 2652 | 939 |
| Age (years) | 48.6 (5.8) | 48.7 (5.8) |
| Ethnicity (%) | ||
| White | 94.0 (93.0;94.9) | 87.3 (85.0;89.4) |
| Asian | 4.0 (3.2;4.8) | 5.3 (4.0;7.0) |
| Black | 1.6 (1.1;2.1) | 5.6 (4.3;7.3) |
| Unknown/other | 0.5 (0.2;0.8) | 1.7 (1.0;2.8) |
| BMI (kg/m2) | 24.8 (2.9) | 24.8 (4.0) |
| Waist circumference (cm) | 87.1 (8.6) | 74.3 (10.7) |
| Hip circumference (cm) | 96.4 (5.6) | 96.0 (8.6) |
| Waist to hip ratio | 0.90 (0.06) | 0.77 (0.07) |
| Height (cm) | 176.6 (6.6) | 162.6 (6.5) |
| Diastolic blood pressure (mmHg) | 80.2 (8.7) | 76.1 (9.0) |
| Systolic blood pressure (mmHg) | 120.6 (12.6) | 116.3 (13.4) |
| Heart rate (bpm) | 63.0 (10.4) | 65.8 (9.6) |
| Total cholesterol (mmol/l) | 6.4 (1.1) | 6.4 (1.1) |
| HDL cholesterol (mmol(l) | 1.3 (0.3) | 1.7 (0.4) |
| LDL cholesterol (mmol/l) | 4.4 (1.0) | 4.2 (1.0) |
| Triglycerides (mmol(l) | 1.4 (0.7) | 1.0 (0.5) |
| Alcohol intake (units/week) | 12.3 (13.3) | 5.8 (6.9) |
| Moderate or vigorous exercise (hrs/week) | 4.0 (4.0) | 2.5 (3.6) |
| Employment grade (%) | ||
| Administrative | 42.3 (40.4;44.2) | 17.4 (15.0;19.9) |
| Prof/exec | 53.1 (51.2;55.0) | 47.5 (44.3;50.7) |
| Clerical/support | 4.6 (3.8;5.5) | 35.1 (32.1;38.3) |
| Smoking habits (%) | ||
| Never-smoker | 52.0 (50.0;53.9) | 62.5 (59.3;65.6) |
| Ex-smoker | 38.4 (36.6;40.3) | 26.6 (23.8;29.6) |
| Current smoker | 9.6 (8.5;10.8) | 10.9 (8.9;13.0) |
| Fasting plasma glucose (mmol/l) | 5.3 (0.5) | 5.0 (0.5) |
| 2-hour plasma glucose (mmol/l) | 5.4 (1.7) | 5.7 (1.8) |
| ------------------------ | ------------------------ | ------------------------ |
| Pulse wave velocity (m/s) | 8.5 (2.0) | 8.2 (2.0) |
| Mean blood pressure (mmHg) | 94.3 (10.6) | 91.1 (11.7) |
| Diabetes incidence (%) | 12.5 (11.3;13.8) | 13.4 (11.3;15.8) |
| Non-fatal CHD incidence (%) | 7.1 (6.1;8.1) | 6.4 (4.9;8.1) |
| Anti-hypertensive treatment history (%) | 34.4 (32.6;36.2) | 33.0 (30.0;36.1) |
| Lipid lowering treatment history (%) | 32.6 (30.8;34.4) | 25.7 (22.9;28.6) |
Characteristics of the study population
Conclusion: We show that central obesity and dyslipidemia are strong determinants of arterial stiffness up to 16 years later, with particular emphasis on central obesity among men and triglycerides among women.
Data are means (SD) or proportions (95% CI) except for the number of participants (N).
Data below the dotted line are follow-up characteristics.
Cite this article
TY  - JOUR
AU  - N.B. Johansen
AU  - D. Vistisen
AU  - M. Shipley
AU  - I.B. Wilkinson
AU  - C.M. McEniery
AU  - A.G. Tabák
AU  - M. Kivimäki
AU  - E.J. Brunner
AU  - D.R. Witte
PY  - 2010
DA  - 2010/12/02
TI  - P9.01 DETERMINANTS OF ARTERIAL STIFFNESS: A 16-YEAR FOLLOW-UP FROM THE WHITEHALL II STUDY
JO  - Artery Research
SP  - 171
EP  - 172
VL  - 4
IS  - 4
SN  - 1876-4401
UR  - https://doi.org/10.1016/j.artres.2010.10.093
DO  - 10.1016/j.artres.2010.10.093
ID  - Johansen2010
ER  -
